Introduction
There’s an old saying that “a picture is worth a thousand words.” Well, economic graphs are “pictures” that tell a story—and sometimes tell it better than words.
In early 2016 the Institute for Policy Innovation identified 10 charts intended to tell the story of how President Barack Obama’s economic policies were impacting the country. While the economy had improved since he entered office, economic growth was well below historic norms—especially given the usually strong post-recession bounce-back that never emerged. During his last year in office, even those gains began to slow.
We are now approaching the two-year mark of the Trump administration, and the economic news is very positive. Oddly, critics are trying to credit Obama for the strong economic indicators, even as they complain that President Donald Trump is rolling back so many of Obama’s “achievements.”
We believe the data indicate that the strong economy is a direct result of President Trump’s and the Republican-led Congress’s efforts to reduce taxes and regulations.
To bring this information to the public, we are releasing an updated version, again with 10 graphs telling the story.
The graphs demonstrate the economy was improving under Obama, but slowly and often sporadically. And some indicators were plateauing. His defenders have argued that Obama’s slow-growth economy was the “new normal.” We countered that would only be true if high tax rates, hyper-regulation, and mandated wage and benefits increases were the new normal. Fortunately, they weren’t.
Beginning in 2017 many economic indicators began improving, leading to new highs in economic growth and new lows in areas such as black and Hispanic unemployment. Those improvements are a direct result of embracing a market-oriented agenda, including regulatory rollbacks, tax cuts and limited government.
Even so there are at least two warning flags. One is government debt, which has continued to grow at about the same pace as under Obama. The other is the growing trade war, whose outcome and impact at this point remain uncertain.
Private sector investment, not government spending, is the catalyst for economic growth and the best way to address poverty and income inequality. Trump knew and promised that upon taking office. For the time being, Obama’s slow-growth policies have been caged, and as a result the economy has been set free.
U.S. Unemployment
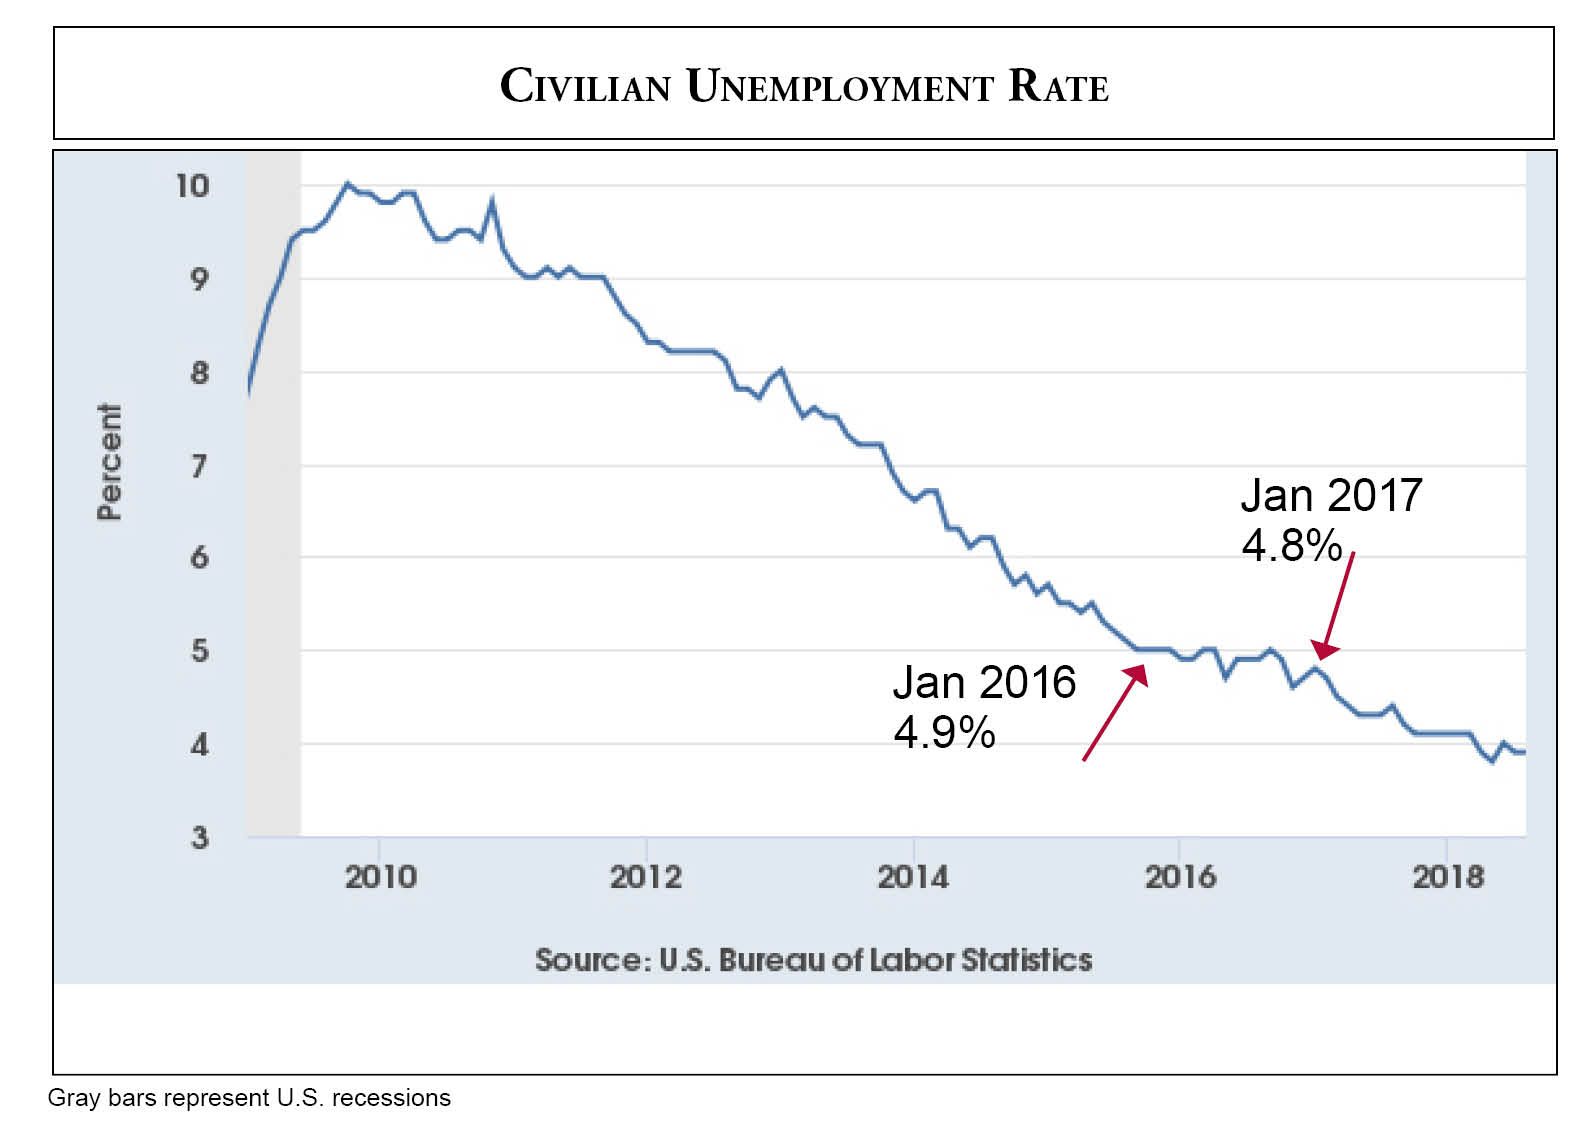
The U.S. unemployment rate has been trending down since October 2009, after peaking at 10 percent. But notice the downward trend began leveling off in January 2016 at 4.9 percent. In early 2017, it broke through the Obama economy’s unemployment floor. It is currently under 4 percent, a level that hasn’t occurred since the fall of 2000, and before that in the late 1970s. We think it is very likely that had Hillary Clinton been elected and continued Obama’s high-tax and regulatory policies, unemployment would never have fallen to 4.5 percent, much less crossed the 4 percent threshold.
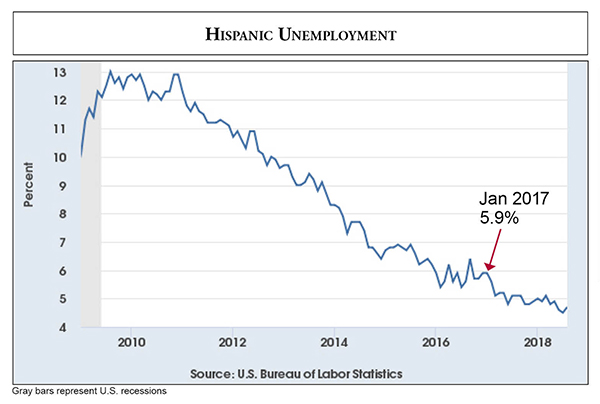
Both black and Hispanic unemployment have reached historic lows recently. However, in this graph it is clear the Hispanic unemployment rate fluctuated at between 5 and 6 percent for the whole of 2016, never reaching the previous low set in 2006-7. But newfound business optimism beginning in 2017 helped push the unemployment rate much lower.
Unemployment Claims
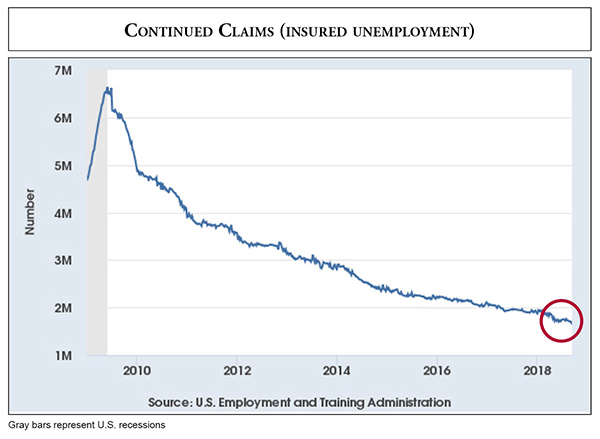
The number of workers receiving unemployment benefits has declined steadily since May 2009, although the pace of that decline began to slow in 2014 and 2015. During Obama’s last year in office, the number of people receiving unemployment benefits dropped from about 2.23 million in January 2016 to 2.04 million in January 2017, a decline of nearly 200,000 people. During Trump’s first year in office those receiving unemployment benefits dropped to 1.94 million, a decline of only 100,000. However, since January, right after the Republican tax bill passed, through September, the number receiving unemployment benefits lowered to 1.64 million. That’s a decline of 300,000 in eight months, indicating a significant increase in employment opportunities.
Economic Indicators
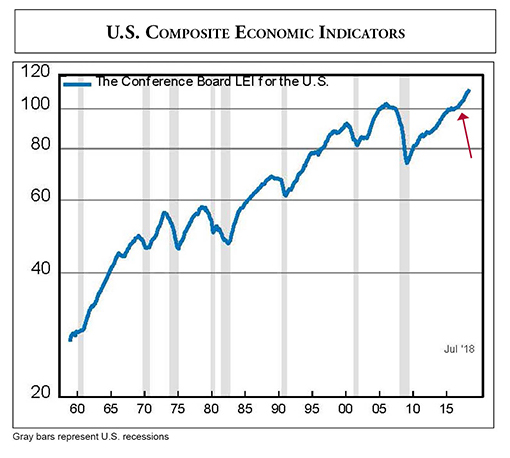
One of the best aggregate indicators of the economy is the Conference Board’s Index of Leading Economic Indicators. The Index includes 10 components that provide a snapshot of the economy. It also serves as a good predictor of coming recessions. As can be seen in the Conference Board’s graph, since 1970 the LEI always turns down prior to a recession.
The Index flattened out twice during the Obama administration, with the last one coming toward the end. Since then it has continued a solid climb.
Manufacturing
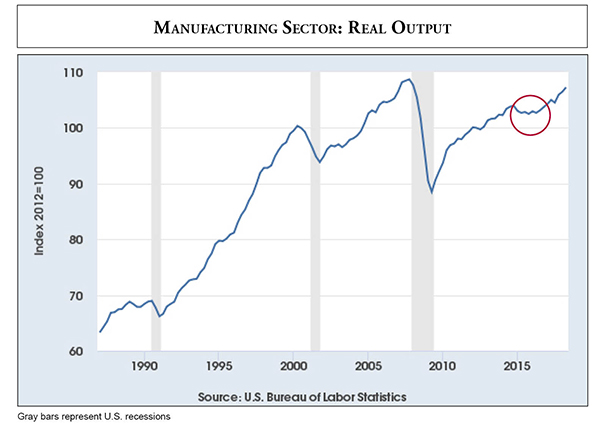
While President Trump focuses on manufacturing jobs, we are more concerned with manufacturing output, since technology, not trade, has been the great destroyer of manufacturing jobs. For example, manufacturing jobs peaked at 19.5 million in June of 1979. Today that number is about 12.7 million jobs.
By contrast, manufacturing output has continued to grow. Notice in the St. Louis Federal Reserve Bank (FRED) graph that output increased after the 2007-9 recession, but peaked in the fourth quarter of 2014 and didn’t return to that level until the fourth quarter of 2016. It has since climbed to just below its historic high, which it reached in the fourth quarter of 2007.
Business Confidence
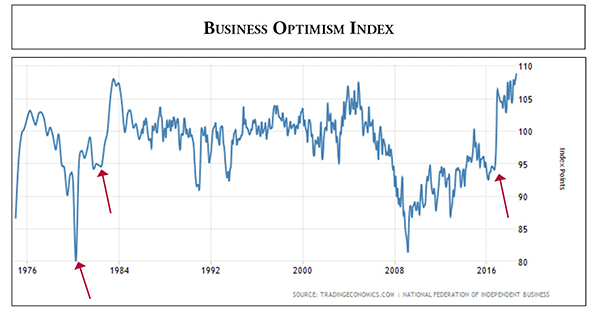
Closely correlated with rising economic indices is rising business confidence. If business owners are optimistic about the future, they hire, invest and expand; if they aren’t, they begin scaling back. It’s a positive feedback loop. A strong economy fuels business investment, which boosts the economy even higher.
The National Federation of Independent Business has long tracked business optimism. And like so many other indicators, it has reached a record high.
Notice the dramatic upward shift in confidence at the end of 2016. But it wasn’t the only time business optimism jumped that high; it did so around the 1980 election of Ronald Reagan and shortly after the 1981 passage of his first tax cut legislation.
Consumer Confidence
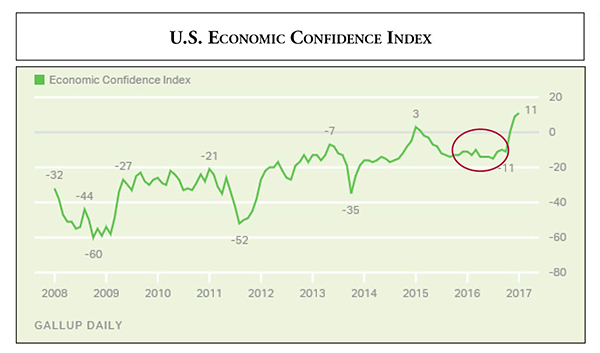
And it’s not just businesses that are optimistic. Consumers have also become more optimistic, a natural response when people are experiencing rising incomes and seeing “help wanted” signs.
The Gallup polling company tracks consumer economic confidence, which leaped at the end of 2016, after a year of being flat.
Although Democrats have continually complained that President Trump’s changes to the Consumer Financial Protection Bureau have dramatically hurt consumers, that sentiment is not showing up in the consumer confidence poll. It has remained higher during Trump’s term than it was during most of the Obama years.
Stock Markets
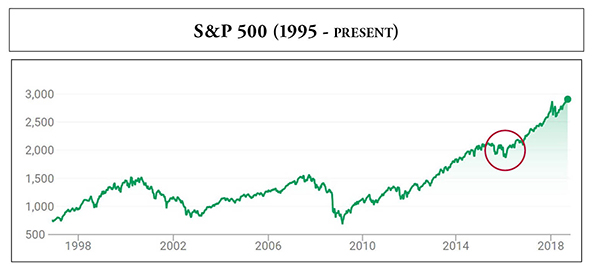
The stock market typically reflects, and even anticipates, what is happening in the economy. And the market is pleased. Just look at the S&P 500 Index.
It certainly rose during Obama’s eight years, but it remained flat for the last two years of his administration. On Oct. 31, 2016, one week before the presidential election, the S&P 500 stood at 2,085. It was at 2,075 on Dec. 1, 2014. Today it is hovering around 2,900—an increase of about 33 percent.
The S&P 500 in its current form was created 60 years ago in 1957. It has gained a third of its total value in the past 22 months.
Federal Debt
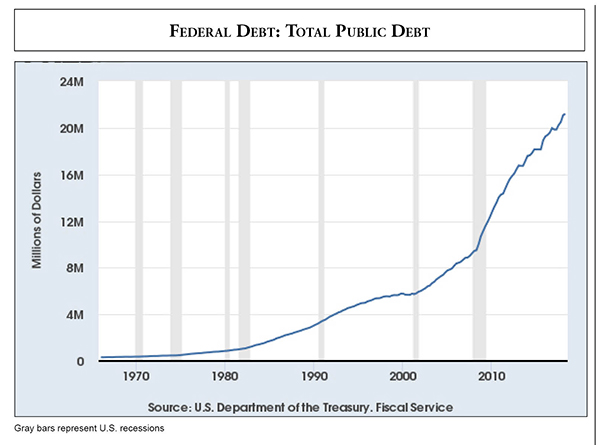
While there are many positive aspects in the Trump economy, it isn’t all good. Federal debt has continued to rise at almost the same rate as during the Obama years—to about $21.2 trillion by the end of 2018’s second quarter.
There appears to be little Republican will to take control of Congress’s spending addiction, despite what GOP candidates say on the campaign trail. President Trump has asserted he won’t sign another pork-laden spend-fest, as he did when he signed the $1.3 trillion spending bill in March of 2018. We hope that’s another promise kept.
No one knows for sure how much longer the spending binge can continue before it begins to significantly affect economic growth; it may already be a drag on the economy. But Congress and the president need to act before we find out.
Public Opinion
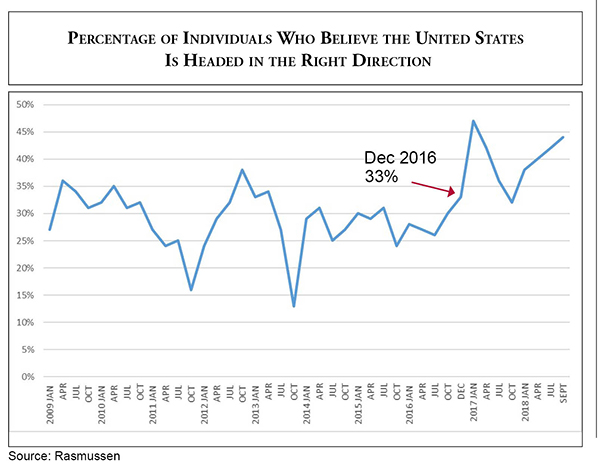
Is the country headed in the right direction? Rasmussen Reports has been asking that question weekly for several years. According to its surveys, Obama’s “right direction” poll numbers generally ranged from the high 20s to low 30s, though they occasionally dropped into the low- to mid-teens, as they did in 2011 and 2013.
But notice the survey begins to climb in January of 2017, reaching 47 percent the week after Trump’s inauguration. It declined in part because of the Republican failure to repeal Obamacare. It remains in the high 30s to low 40s. In short, a much larger percentage of the public see the country moving in the right direction under Trump than did under Obama.
Conclusion
The lesson here is policies matter. Yes, the economy improved under President Obama, but was never going far or fast because he constantly applied the policy brakes.
Obama entered the White House in the middle of a deep recession. Instead of unleashing the economy by lowering taxes and reducing regulations, he and Democrats took the opposite approach. Plus, they poured taxpayer money into the economy, arguing that massive government spending would create jobs, contain the recession and lead to a burst of economic growth. When none of that happened, they blamed President George W. Bush, lowered their expectations—the slow-growth economy was the new normal—and took a victory lap.
We contended at the time that tepid economic growth occurred in spite of Obama’s policies, not because of them. And we argued that lowering taxes, reducing regulations and unshackling employers would lead to stronger economic growth. Democrats never embraced that approach; Trump did. The graphs included in this publication demonstrate who was right.

