Introduction
Widespread piracy of motion pictures, recorded music, software, and electronic games harms the companies that design, create and sell these products. Since many of these are American companies, the harm of global copyright piracy falls disproportionately on U.S. industry, its stockholders and employees, and on federal, state and local governments that lose tax revenue due to piracy.
The U.S. companies most directly affected by piracy have long sought to increase understanding of the scope of this problem, and to encourage government-wide efforts to address this threat. However, until recently, there has been little reliable economic information available to U.S. policymakers to assist them in balancing the importance of enforcing intellectual property rights as against other priorities. In order to address this issue, in 2005, a study entitled Engines of Growth: Economic Contributions of the U.S. Intellectual Property Industries was published.3 That study analyzed the contributions to the U.S. economy of the U.S. “IP industries” – industries that rely most heavily on copyright or patent protection to generate revenue, employ and compensate workers and contribute to real growth. The study found, among other things, that these IP industries are the most important growth drivers in the U.S. economy, contributing nearly 40% of the growth achieved by all U.S. private industry and nearly 60% of the growth of U.S. exportable products. It also found that the IP industries were responsible for one-fifth of the total U.S. private industry’s contribution to GDP and two-fifths of the contribution of U.S. exportable products and services to GDP.
To build on these data, in September 2006, the Institute for Policy Innovation (IPI) published The True Cost of Motion Picture Piracy to the U.S. Economy (the Motion Picture Piracy study). 4 Subsequently, in August 2007, IPI published The True Cost of Sound Recording Piracy to the U.S. Economy (the Sound Recording Piracy study). Both of those studies measured the economic impact of pirate activities in a single industry on the U.S. economy as a whole.
Expanding on the analyses used in the Motion Picture Piracy study and the Sound Recording Piracy study, this study measures the combined effects of pirate activities on a group of U.S. industries that, like the motion picture and sound recording industries, rely heavily on the effective enforcement of copyright.
I. The Copyright Industries
This study measures the costs of piracy for four of the “core” copyright products: motion pictures, sound recordings, packaged software, and video games. The study measures these costs at both the production and at the downstream, retailer level. In addition, through the use of industry-specific “multipliers,” the study quantifies the additional costs of piracy on the upstream industries that supply the copyright producers and on the suppliers to those suppliers through the U.S. economy as a whole.
Because this study focuses only on four copyright industries, it provides an incomplete picture of the overall costs of copyright piracy to the U.S. economy. The copyright industries in the United States that are affected by piracy represent a much larger number of companies and employees, including photographers, songwriters, magazine and book publishers, and other creators. A fuller description of the copyright industries can be found through the website of the Copyright Alliance, www.copyrightalliance.org.
U.S. Motion Picture and Video Industry
The U.S. motion picture and video industry, classified as NAICS 5121in U.S. government statistical reports called the North American Industry Classification System (NAICS), 5 includes motion picture and video production, motion picture and video exhibition, postproduction services and “other” motion picture and video industries. In 2005, the industry had estimated revenue of $73.4 billion. 6
U.S. Sound Recording Industry
The U.S. sound recording industry (NAICS 5122) includes establishments primarily engaged in producing and distributing musical recordings, publishing music, providing sound recording services and “other” sound recording industries. According to the U.S. Census Bureau, the employer firms in the U.S. sound recording industry generated revenue of $18.7 billion in 2005. 7
U.S. Software Publishing Industry
The U.S. software publishing industry (NAICS 5112) comprises establishments engaged in computer software publishing or in both software publishing and reproduction. These companies “carry out operations necessary for producing and distributing computer software, such as designing, providing documentation, assisting in installation, and providing support services to software purchasers.” 8 In 2005, employer firms in the U.S. software publishing industry had revenues of $119.6 billion. 9
U.S. Entertainment Software and Video Game Industry
The NAICS codes do not show the U.S. entertainment software and video game industry under a separate classification. Within the NAICS framework, the entertainment software industry remains part of the U.S. software publishing industry described above. Industry sources report that in 2005, U.S. retail sales of video game software was $7.0 billion, rising to $7.4 billion in 2006. 10
Foreign Sales of the U.S. Copyright Industries
The copyright industries rely significantly on sales in both the U.S. and foreign markets. In 2005, the recorded music, motion picture, packaged software and book and periodicals industries achieved combined foreign sales of $110 billion. 11 Just as in the U.S., sales of pirated products in foreign markets reduce the legitimate sales that would have occurred in those markets. Moreover, copyright piracy in foreign markets directly harms American-based production of these products.
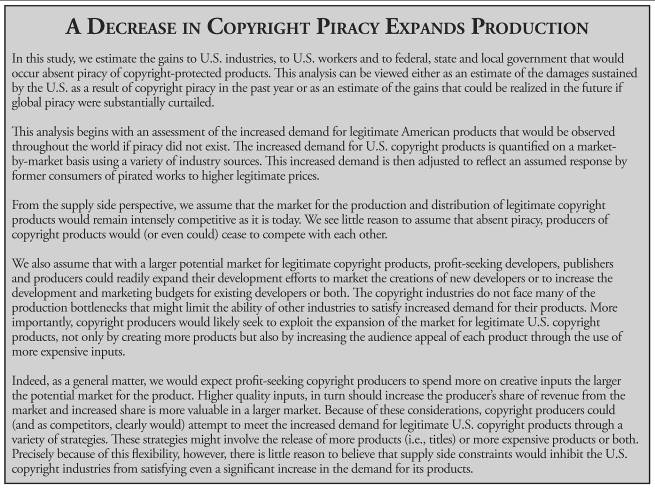
The products that are created and sold by the U.S. copyright industries consist largely, but not entirely, of what economists call a “public good.” 12 A “pure” public good “is one whose cost of production is independent of the number of people who consume it; more precisely, one person’s consumption of such a good does not reduce the quantity available to other people.” 13 Since production costs are fixed with respect to the number of people who consume the product, cost per user or per viewer declines as market or audience size increases. As firms in the copyright industries compete, they are inevitably driven to expand the size of their markets and thereby reduce their costs per user. For this reason, all of the U.S. copyright industries have long sought and achieved significant expansion into foreign markets.
Since revenues for the U.S. copyright industries are now generated from both U.S. and foreign markets, the copyright industries reasonably expect that such revenues will continue to flow in the future. Thus, the budgeting process for copyright products tends to approve new product budgets that maximize profits across all markets. For this reason, copyright piracy in any market will affect the total sales and profits earned by the U.S.-based producers of these products. In this study, the worldwide piracy losses of U.S. producers and distributors of copyright products are used to assess the impact of piracy on U.S. production of copyright products. (See Sidebar “A Decrease in Piracy Expands Production”).
U.S. Retail Industry
Copyright piracy affects more than the companies that produce and distribute copyrighted products. Legitimate retailers, such as Blockbuster, Best Buy, Wal-Mart, and Circuit City, sell DVDs, CDs, packaged software and video games under licenses with the manufacturers of these products. When consumers obtain pirated versions of these products, profits also decline for the legitimate retailers who would, absent piracy, have made these sales. Unlike U.S. producers of copyright products, U.S.-based retailers are not generally affected by foreign piracy. They are, however, affected by U.S.-based copyright piracy. This study measures the costs of U.S.-based copyright piracy to the U.S. retail industry and to its upstream supplier industries.
II. The Interdependent Economy
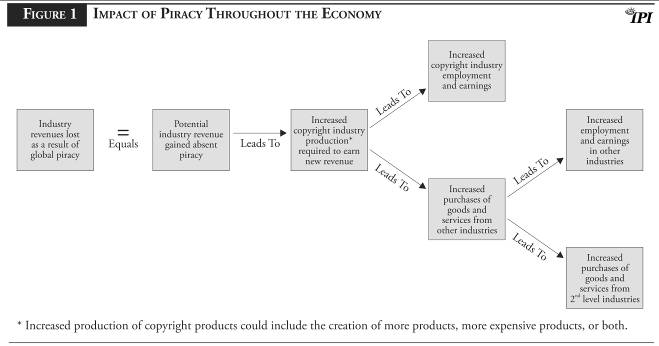
The economic impact of copyright piracy is not limited to the companies that design, create and sell copyright protected works. The impact of piracy flows throughout the U.S. economy. Piracy in one segment of the economy can affect other industries because the economy is an interdependent system. Changes in supply or demand in one industry can and do affect supply and demand in other industries.
For example, assume that hybrid vehicles suddenly became very popular and shortages develop. In this situation, the price of hybrid vehicles will rise and so will the profits of the manufacturers. However, in order to continue to earn these higher profits, the manufacturers will have to make more hybrid vehicles. In the process, they will buy, among other things, more parts from parts manufacturers.
Of course, the process doesn’t stop there. In order to produce more parts, the parts manufacturers will have to buy more materials from their suppliers. And those suppliers will have to buy more of the particular materials that they need.
Moreover, the cascade does not end with the hybrid vehicle manufacturers. It continues downstream as well. The retail sellers of hybrid vehicles who buy from the manufacturers will also be able to earn more money by raising prices or by increasing volume.
What is true for hybrid vehicles is equally true for the copyright products discussed here. If the revenue generated by making and selling these products increases (in this case, not by higher demand but by a decrease in piracy), the companies that create and distribute these products will create more of them. They may also invest in higher quality products, broader distribution or marketing, or some combination of all of these activities in order to maximize their profits (See Sidebar “A Decrease in Piracy Expands Production”).
As more copyright products are created, and more funds are invested in developing, testing, marketing and distributing such products, the people and the companies that serve as suppliers to the copyright industries will also benefit. The “output” of these companies will also increase. Moreover, as the output of these suppliers increases, so too, in turn, will the output produced by the other industries that supply the suppliers.
These kinds of interactions among industries are captured in input-output tables. Input-output tables measure the interrelationships that exist among different industries. With this information, one can estimate what impact a specific change in one industry will have on other industries.
A visual depiction of the process is outlined in Figure 1.
III. Piracy Loss Estimates for the Copyright Industries Data and Methodology
This Section discusses how this study derived piracy loss estimates for each of the four industries examined: motion pictures, sound recording, software, and videogames.
The Motion Picture Industry
For the motion picture industry, loss figures produced by a major consumer research study conducted by the firm of LEK Consulting were utilized. The LEK research revealed that the member studios of the Motion Picture Association of America (MPAA) lost $6.1 billion to movie piracy in 2005. 14 These figures were also used in the Motion Picture Piracy study, and the loss estimates from that report remain sufficiently timely and detailed to be included again here .
The Sound Recording, Software Publishing and Video Game Industries
Other copyright industries analyzed in this report did not have an exact analogy to the LEK study. Accordingly, additional data were collected and evaluated from and about each of these industries.
The principal sources used to estimate piracy losses for this report included the following:
- Internal estimates of piracy losses compiled by each of the copyright industries.
- Confidential estimates of piracy losses developed by others on behalf of individual copyright industries.
- Piracy loss estimates from “Special 301” filings with the USTR.
- Sales data by country and physical piracy rates for recorded music from the Recording Industry Association of America (RIAA) and the International Federation of the Phonographic Industry (IFPI).
- Piracy rates and piracy losses by country for packaged software from the Business Software Alliance (BSA) and International Data Group (IDC).
- National and trade press articles and press releases.
- Academic journals.
Each of the copyright industries that were studied in this report was able to provide certain internal statistics on piracy losses. Some of these statistics were confidential estimates that cannot be reported directly in this study. Other piracy loss statistics are developed and published by industry trade associations and are widely distributed.
A major source of relevant information was the annual piracy loss estimates that are filed with the office of the United States Trade Representative (USTR). These estimates are compiled for all the major copyright industries and placed into the public record each year in support of the industries’ Special 301 filings. The Special 301 piracy loss estimates for 2005 are shown, by region, in Table 1. As reported in Table 1, the combined losses estimated by all four copyright industries for all regions were nearly $17 billion.
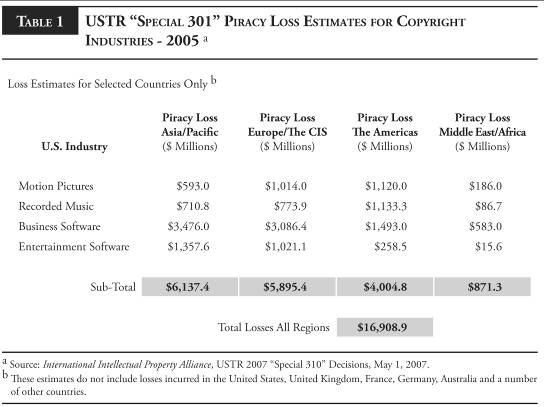
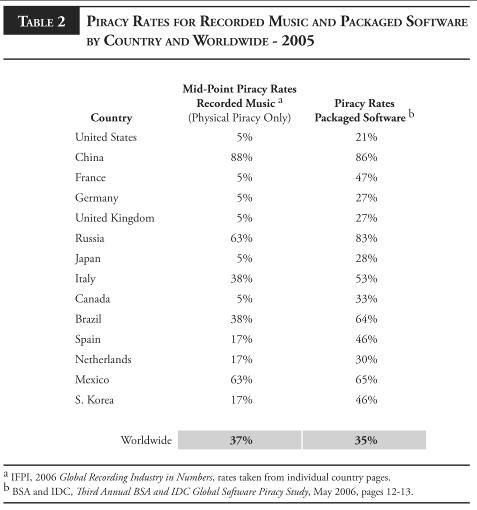
The Section 301 loss figures, however, understate the true extent of piracy losses, because they do not include piracy estimates for such major markets as the United States, the United Kingdom, France, Germany, and Australia. Thus, a more accurate accounting of piracy losses sustained by the U.S. copyright industries that includes those countries omitted by the Section 301 figures is reflected in a number of industry-specific studies that are publicly available. For example, in the recorded music industry, the International Federation of Phonographic Industry (IFPI) found that in 2005, an estimated 1.2 billion pirate CDs were purchased and that, even at reduced pirate prices, the worldwide pirated CD market could be valued at $4.5 billion. 15 IFPI also reports piracy rates for the physical 16 piracy of recorded music in individual countries. These piracy rates reflect the number of pirate units sold divided by the total (pirate and legitimate) units sold.
Piracy rates by country are similarly available for the packaged software industry in the annual piracy reports that are published jointly by the Business Software Alliance (BSA) and the International Data Group (IDC). Piracy rates by country for the recorded music and packaged software industries are provided in Table 2. While these data show variations across countries as between the two products, the weighted-average global piracy rate for both industries remained in a range of 35-37%.
Conservative Adjustments to Industry Estimates
While the copyright industries that were examined individually develop and publish estimates of the losses they sustain from pirate activities, the methodologies they use and assumptions they rest on are different. This study does not attempt to impose a judgment as to which methodologies and assumptions produce the most accurate count of piracy loss. As with any economic study, each methodology and set of underlying assumptions provides some insight into the scope of the problem; each has its strengths and weaknesses, its proponents and detractors.
At the same time, a decision to simply combine the results of four disparate sets of industry loss figures with no effort to identify and adjust even the most glaring inconsistencies among those figures would be unlikely to yield an accurate result. Such a procedure would have applied diverse and admittedly inconsistent piracy loss estimates to a consistent set of industry multipliers. Accordingly, in this study a series of conservative adjustments were made in order to increase the internal consistency of the loss estimates that were used for each of the copyright industries that were analyzed. These adjustments were conservative in that they tended to reduce the final piracy loss estimates (and thus the economic cost estimates) that were generated in the analysis. These adjustments are discussed below.
The principal differences between the ways different copyright industries approach the daunting problem of measuring piracy losses include:
1. Omission of Geographic Markets. Some industries have not measured piracy losses in every geographic market in which they operate. For these industries to have loss estimates that are consistent with those of other industries, the missing geographic markets should be identified and, where possible, analyzed to measure the piracy losses that were not previously counted. However, the adjusted loss estimates developed in this report conservatively do not include piracy loss figures for all foreign markets for all of the copyright industries that were studied. The inclusion of piracy losses experienced in these additional markets would have increased the piracy cost estimates that were ultimately produced in this study.
2. Inconsistent Estimates of Units Sold Absent Piracy. The industries’ estimates differ as to how they measure the quantity of legitimate unit sales that would have been made absent piracy. Some industries assume that, absent piracy, consumers of pirated products would substitute legitimate purchases for all or nearly all of the pirate purchases that they now make. By contrast, other industries assume that, absent piracy, consumers would purchase fewer products than they now consume, because they would not substitute legitimate products for all the pirated products. While the number of substitute units need not be identical in each copyright industry, an effort has been made in this study to impose a consistent set of assumptions regarding product substitution across the four industries that are analyzed in this report. Again, this report has taken a conservative approach, and not assumed that each pirated product served to deprive the industry of a legitimate sale. Had this “one-to-one” ratio been maintained in any of the copyright industries, the resulting piracy cost estimates would have been higher than the figures reported here.
3. Inconsistent Estimates of Price. Some industries measure the quantity of pirated units in a market and value that quantity at the pirated price : that is, the price at which the pirated goods were actually sold. 17 Other industries value the quantity of pirated units at the legitimate price : the price at which authorized products are sold in the market. For this study, since a one-to-one ratio between pirated goods and legitimate goods was not assumed, it is acceptable to multiply the quantity of legitimate products that would have been sold absent piracy by the legitimate price that prevailed in that market in 2005. The product of this calculation represents the sales that were lost as a result of copyright piracy.
4. Inconsistent Estimates of U.S. Share of Losses from Piracy. The market share of legitimate U.S. copyright products in any given country can and often does vary significantly. As a very general rule, the market share of U.S. copyright products is very high in the United States, somewhat lower in Western Europe and considerably lower in many (but not all) Asian countries. Moreover, the share of all pirated products that are pirate versions of U.S. products can also differ from the U.S. share of legitimate products. In each of their piracy loss studies, the copyright industries address the issue of U.S. share in ways that differ from one industry to the next.
This report attempts to impose some standardization on this issue by comparing each industry’s assumptions and/or calculations of the U.S. industry’s share of This report attempts to impose some standardization on this issue by comparing each industry’s assumptions and/or calculations of the U.S. industry’s share of pirated product to the assumptions and/or calculations made in the other copyright industry reports for the same foreign market . For example, in the LEK study of motion picture piracy, the MPAA member-companies’ losses from piracy in Mexico was estimated at $954 million. 18 This value was approximately 85.6% of the total consumer spending loss from all movie piracy in Mexico (that is, including piracy of films made by non-MPAA members). Thus, at least for pirated movies in Mexico, the U.S. industry’s share of total losses is very high. Based on the LEK results, one would expect, all else equal, that another copyright industry’s share of total piracy losses in Mexico would also be substantial. For example, another copyright industry could have detailed piracy loss estimates for their product in Mexico in which the U.S. share of losses (in that product) was very low, and such discrepancies in the same market would have triggered further analysis and review. In the course of preparing this report, such inconsistencies were considered and where appropriate, adjustments to the figures were made.
Piracy Loss Estimates for U.S. Copyright Industries
After gathering data and making appropriate adjustments so that the loss estimates would be roughly comparable in their methods and assumptions, the estimated piracy losses for the four copyright industries and for the U.S. retail sector were combined. The combined losses used in this study are reported in Table 3.
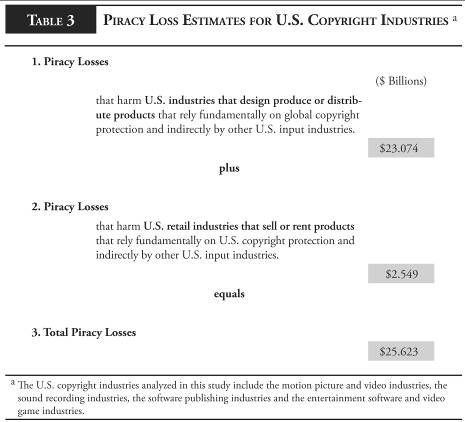
As shown in Table 3, the piracy losses sustained by the four U.S. copyright industries that design, produce and distribute copyright products were estimated at $23.074 billion in 2005. The losses from copyright piracy that are borne by the U.S. retail industry were estimated at $2.549 billion. Thus, the total losses to U.S. producers and retailers from copyright piracy were $25.623 billion.
This study does not break down the combined industry loss figures into its component parts. One reason for that determination was that the underlying loss estimates for each industry were based, at least in part, on confidential information. These data would likely have been revealed if the loss estimates for each industry were reported separately. Nevertheless, based even on the publicly available data, it can readily be seen that the estimate of piracy loss affecting the U.S. economy is extremely conservative. As shown in Table 1, the copyright industries’ piracy losses, as reported to the USTR, were nearly $17 billion -- even though those estimates omitted losses in numerous major markets including the United States, the United Kingdom, France, Germany and Australia.
Moreover, reporting the loss estimates as a lump sum avoided having to arbitrarily choose to which industry category certain products belong. For example, PC games can be considered both software and videogames. Reporting software and videogames separately would have required putting them into one category or another in order not to double count. By reporting only the combined loss results for all copyright industries, potential inaccuracies like this can be avoided.
IV. Industry Multipliers
Input-Output Tables and Multipliers
As noted above, assessing the total cost of copyright piracy for the U.S. economy involves looking at how piracy-induced changes in one industry affect other industries throughout the U.S. economy. This study relies on an analytical framework known as an input-output (I-O) table for this purpose. For every industry in the economy, an I-O table shows the distribution of the inputs purchased and the outputs sold. Using this framework, the U.S. Department of Commerce’s Bureau of Economic Analysis (BEA) has developed a method for estimating I-O multipliers . Using multipliers, it is possible to measure not only the direct effects of piracy (that is, the lost 1 st round of output) but also the indirect effects (that is, the lost 2nd and subsequent rounds of output) as piracy reduces the need for the legitimate industry to purchase inputs from factor suppliers in other industries. In addition, the BEA’s multipliers also take into consideration the “induced” economic effects that arise from the piracy-driven loss in labor income that is borne by workers in the legitimate industries and which results in a consequent decrease in household consumption.
In this analysis, the multipliers used to estimate the full effects of copyright piracy were derived using the BEA’s Regional Input-Output Modeling System or “RIMS II.” The RIMS II model produces industry-specific “final demand” multipliers for output (in dollars), employment (in numbers of employees) and earnings of those employees (in dollars). The RIMS II model also provides industry-specific “direct effects” multipliers for employment and earnings.
Combined Average Multipliers
In this analysis, separate RIMS II multipliers were used for each of the four sectors to estimate the effects of piracy. In addition, each industry-specific multiplier was constructed as a weighted average of multipliers across states where industry production was most concentrated. All of these multipliers are reported in Appendix A. However, by mathematical process, we were able to represent the combined effects of all these calculations as one value. The “combined” In this analysis, separate RIMS II multipliers were used for each of the four sectors to estimate the effects of piracy. In addition, each industry-specific multiplier was constructed as a weighted average of multipliers across states where industry production was most concentrated. All of these multipliers are reported in Appendix A. However, by mathematical process, we were able to represent the combined effects of all these calculations as one value. The “combined” average multipliers that are used in this study to measure the costs of copyright piracy to the U.S. economy are reported in Table 4.
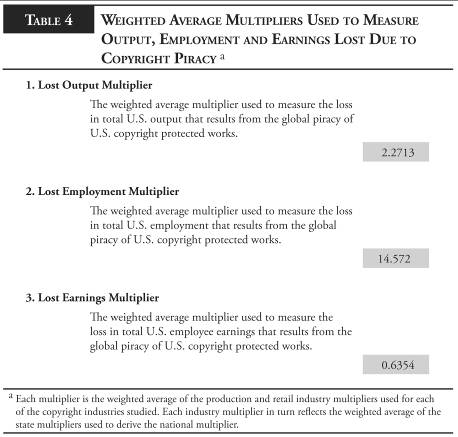
As shown in Table 4, the combined weighted average output multiplier calculated by this study was 2.2713. This means that every dollar lost to copyright piracy by the U.S. copyright industries results in a total loss of output of $2.27. Similarly, the combined weighted average employment multiplier used in this report was 14.572. This means that for every $1,000,000 lost to copyright piracy, the U.S. economy loses 14.572 jobs. Finally, as reported in Table 4, the combined weighted average earnings multiplier was 0.6354. This multiplier reflects that every dollar lost to copyright piracy by the U.S. copyright industries results in a loss of $0.6353 in the earnings of U.S. workers.
V. Tax Losses
The RIMS II modeling system does not yield a loss of tax revenues. Yet the loss of tax receipts that results from copyright piracy represents another significant cost of piracy to the U.S. economy. For the tax loss estimates presented in this study, the methodology previously used in the Motion Picture Piracy and Sound Recording Piracy studies was applied to each of the copyright industries considered here. As in the previous studies, the tax loss estimates are developed for three categories of taxes . These are: (i) lost personal income taxes that would have been paid by copyright industry employees, (ii) lost corporate income taxes of copyright industry companies and (iii) lost production and other business taxes. The details that underlie each of these tax calculations are provided in Appendix B.
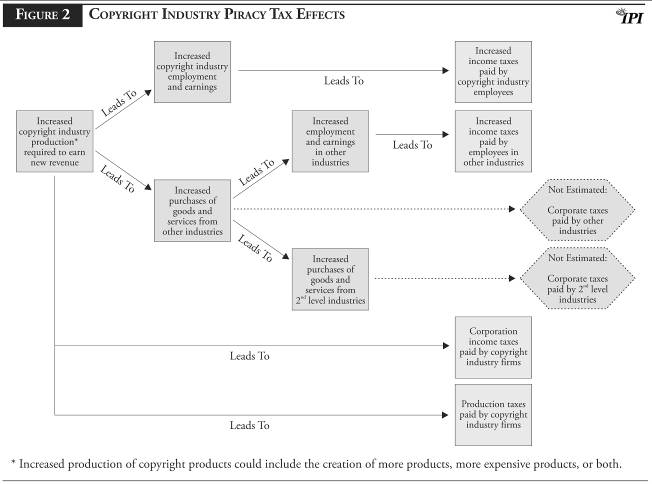
The tax loss estimates presented in this study do not encompass a full accounting of all tax losses attributable to piracy (See Figure 2). The estimates for both corporate income tax losses and production tax losses reflect only the direct losses sustained by the copyright industries themselves. The estimates do not include additional tax losses that would result from decreased income and lower sales in those U.S. industries that supply inputs to the U.S. copyright industries, because that data cannot be derived from the RIMS II model. 19 Accordingly, the corporate income tax and production tax estimates presented in this report conservatively exclude tax losses sustained at U.S. industries that are indirectly affected by piracy.
VI. Findings
Lost U.S. Output
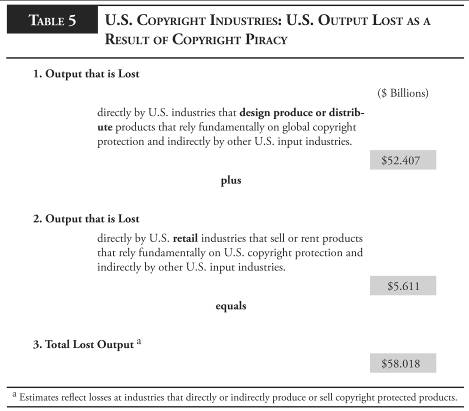
As noted above, this report estimates that, in 2005, the U.S. motion picture, sound recording, packaged software and entertainment software industries sustained combined piracy losses of at least $23.549 billion (See Table 3). In addition, the U.S. retail industry lost another $2.459 billion. Applying the appropriate multipliers as set out above, the report concludes that as a consequence of global and U.S.-based piracy of copyright products, the U.S. economy loses $58.0 billion in total output each year. Of this total, $52.4 billion is output lost at the U.S. production level while $5.6 billion reflects output lost at the U.S. retail level (See Table 5).
Lost U.S. Jobs
The losses sustained by the U.S. copyright industries also translate into lost American jobs. Using other industry-specific “multipliers” from the U.S. Bureau of Economic Analysis, it is estimated that in 2005, the U.S. economy lost approximately 373,375 jobs in total as a result of copyright piracy both in the U.S. and abroad. Of these lost jobs, approximately 312,052 jobs were lost at the U.S. production level in the creation, manufacture and distribution of copyright-protected works while 61,323 jobs were lost at the U.S. retail sales level (See Table 6).
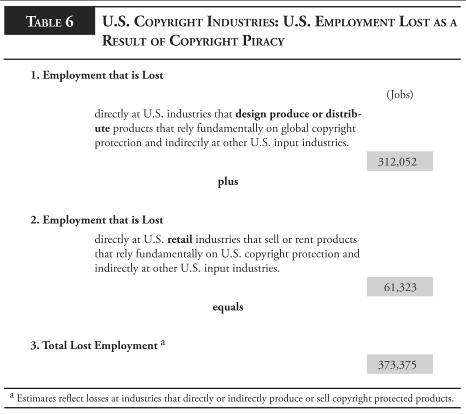
The estimates of lost employment shown in Table 6 include both the direct employment losses sustained by producers and retailers of copyright products and the indirect employment losses experienced at other U.S. industries that depend on copyright producers and retailers. Of the total job loss of 373,375 reported above, 123,814 jobs were lost at establishments that directly produce or sell copyright products. The remaining 249,561 jobs were lost at other non-copyright U.S. industries that are indirectly harmed by global piracy in copyright products. 20
Lost Earnings of U.S. Workers
Using additional multipliers from the U.S. BEA, it is estimated that, because of copyright piracy, U.S. employees lose $16.3 billion in total earnings annually. Of this total, $14.6 billion are earnings lost at the U.S. production level for the creation and manufacture of legitimate copyright products, while $1.7 billion are earnings lost at the U.S. retail level (Table 7).
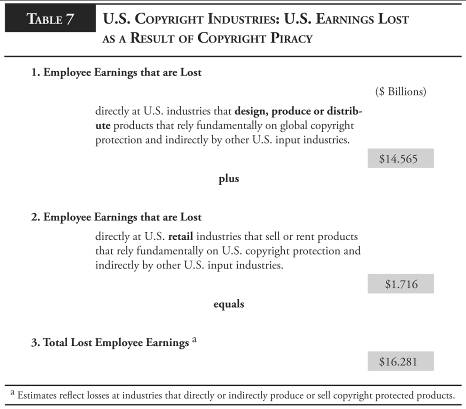
As with the employment estimates provided in Table 6, the lost earnings calculations shown in Table 7 include both the direct earnings losses sustained by workers at firms that produce and sell copyright products and the indirect earnings losses experienced by workers at other U.S. industries that depend on copyright producers and retailers. Of the total earnings loss of $16.281 billion reported above, $7.164 billion were lost by workers at establishments that directly produce or sell copyright products. The remaining $9.117 billion in earnings were lost by workers at other non-copyright U.S. industries that are indirectly harmed by global piracy in copyright products.
Lost Tax Revenues
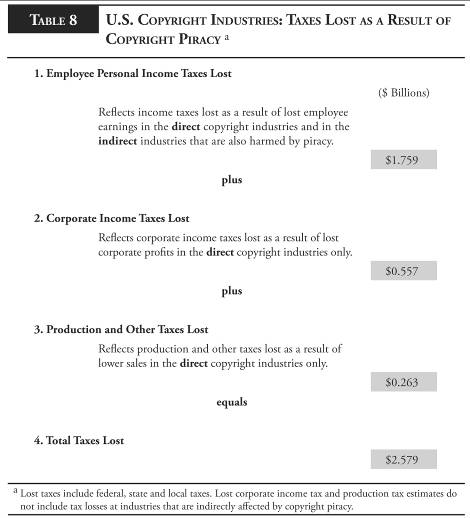
The harm of copyright piracy extends to governments at the federal, state and local level, which lose significant revenue as a result of copyright piracy in the U.S. and overseas. This study estimates that governments lose a minimum of $2.6 billion in tax revenues annually. Of this amount, $1.8 billion represents lost personal income taxes while $0.8 billion is lost corporate income and production taxes (See Table 8). These numbers surely underestimate actual losses because the corporate income tax and production tax loss estimates do not include estimated income and production tax losses at the upstream supplier level of the economy. The tax losses that were estimated in this study are shown in Table 8.
Conclusion
Copyright piracy harms a broad segment of the U.S. economy that extends far beyond the U.S. companies that distribute copyright protected works. Because of piracy, American writers, artists, designers, actors, software and video game developers and musicians are denied compensation for the fruits of their creative efforts. And, since the products that embody these efforts are highly valued by consumers the world over, this loss in compensation to the American creative community is increasingly significant, even as measured against the U.S. economy as a whole.
Moreover, the economic damage caused by global copyright piracy also extends to the up-stream industries in the U.S. that directly and indirectly supply inputs to the U.S. motion picture, recorded music, packaged software and entertainment software industries. Since the industries in the U.S. economy are interdependent, losses from copyright piracy extend through the U.S. economy as a whole. In this study, the total costs to the U.S. economy of copyright piracy are estimated to exceed $58 billion in lost output, 373,375 lost jobs, $16 billion in lost employee earnings and more than $2.6 billion in lost tax revenues. These estimates underscore the true magnitude of the copyright piracy problem to the U.S. economy as a whole.
Appendix A — Multipliers for the Copyright Industries
In the RIMS II model, the U.S. Bureau of Economic Analysis estimates five different industry and region-specific multipliers. These five multipliers are 1) total output, 2) total employee earnings, 3) total number of employees, 4) direct employee earnings and 5) direct number of employees. The first three “Final Demand” multipliers measure the economic impacts that result from an initial change in the output delivered to final users. The fourth and fifth “Direct Effects” multipliers measure the subset of those earnings and employment effects for the industry that was directly affected by the initial change. In the model, each of these five multipliers is calculated for a specific industry (as defined by a NAICS code). In addition, the model must be preset for a region or state. In this study, individual states are used as the relevant regions to be analyzed for each copyright industry under study.
In RIMS II, it is important to consider the “region” to be analyzed in the model because the region defines the geographic boundary within which an “input” from another industry will be counted in the computation of each mul In RIMS II, it is important to consider the “region” to be analyzed in the model because the region defines the geographic boundary within which an “input” from another industry will be counted in the computation of each multiplier. Recall that multipliers rely on “input-output” tables that report how individual U.S. industries purchase and supply goods and services to other individual U.S. industries. If a supplying industry is located in the region to be studied, the “inputs” provided by that industry will be counted in the development of the multiplier for that region. If the supplying industry is not located in the region to be studied, the “inputs” provided by that industry will not be counted in the development of the multiplier for that region.
This concept is easiest to see in the case of imports. If a U.S. industry purchases Import X from a non-U.S. supplier, the RIMS II model assumes that the upstream products needed to produce Import X would, like Import X, also have been manufactured by non-U.S. upstream suppliers. Since the additional inputs needed to manufacture Import X are not made in the United States, the model does not attempt to measure the effects of those additional inputs on the U.S. economy.
This basic concept also applies in the case of total U.S., U.S. county, state and U.S. local area multipliers. All else equal, total U.S. multipliers are higher than U.S. state multipliers and U.S. state multipliers are, in turn, larger than U.S. local area multipliers. In the motion picture industry for example, the output multipliers estimated by BEA for the states of California and New York were 2.9398 and 2.6002 respectively. By contrast, the total U.S. output multiplier for the motion picture industry was 3.5552.
In this study only state multipliers are used. The decision to use only state specified multipliers in this study means that the results are inherently conservative. Had total U.S. multipliers been used, the estimates of piracy effects on the U.S. copyright industries would have been considerably higher than the figures reported here.
Multipliers for the Motion Picture and Sound Recording Industries
The products that are created and produced by the U.S. copyright industries are sold throughout the United States. Through their distribution and sales activities, the copyright industries thus produce real economic value in every U.S. state. In terms of production activities however, the U.S. copyright industries are more prominent in some states than in others.
In the U.S. motion picture industry, for example, two states – California and New York – employed 50.3% of all U.S. workers in NAICS 5121. In the U.S. motion picture industry, for example, two states – California and New York – employed 50.3% of all U.S. workers in NAICS 5121. 21 In addition, for the six-digit NAICS 512111, the motion picture and video production industry, the states of California and New York employed 73.4% of all employees. 22 For these reasons, the final demand multipliers used to analyze the motion picture industries in NAICS 5121 were multipliers for California and New York (See Table A-1).
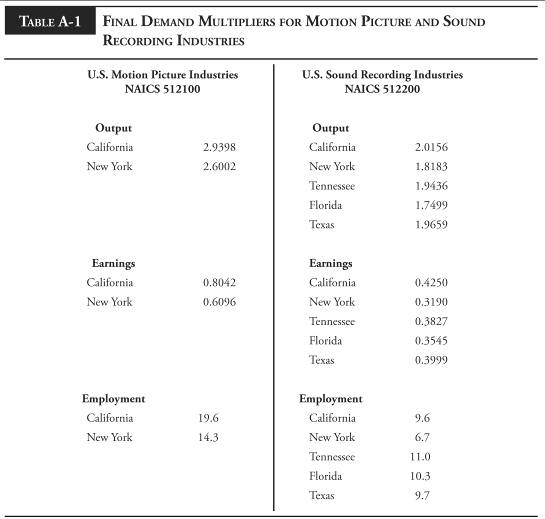
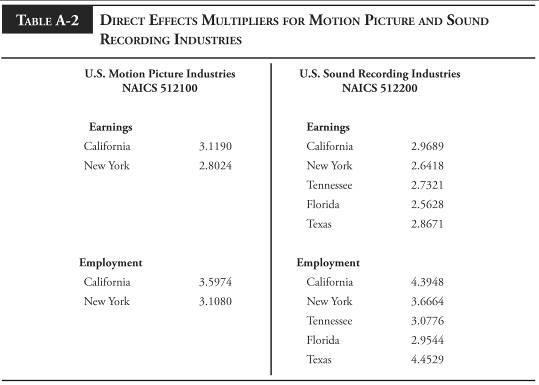
In terms of production activities, however, the U.S. sound recording industries were similarly focused on only a few states. As shown in Table A-1, the final demand multipliers used to estimate the costs of sound recording piracy were specific to five states including California and New York. Three other states – Tennessee, Florida and Texas – also supported fairly sizeable employment levels in the sound recording industry. Based on discussions with industry representatives, the employment levels in these states also reflect the traditional importance of these states to specific types of music. The direct effects multipliers that were used in this study for the U.S. motion picture and sound recording industries are shown in Table A-2.
Multipliers for the U.S. Software and Entertainment Software Industries
As for the motion picture and sound recording industries, centers of production were identified for which software industry multipliers would be appropriate. For the software publishing industry, five states – California, Washington, Texas, Massachusetts and New York – collectively employed 56% of all workers in NAICS 5112. Final demand multipliers for these five states are reported in Table A-3.
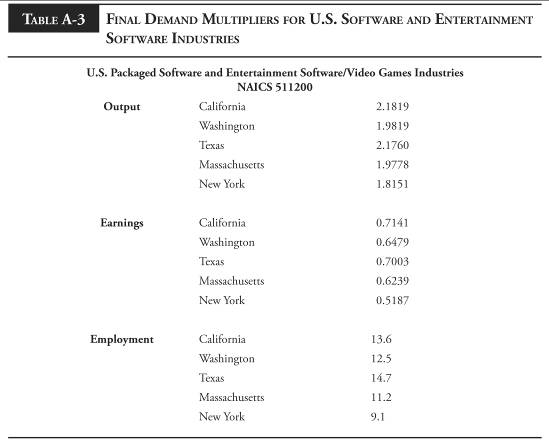
As noted in the text of this report, U.S. government statistics for the entertainment software and video games industry are generally not published on a separated basis. As a result, the software publishing industry final demand multipliers reported in Table A-3 above are also appropriate for the entertainment software and video games subset of that industry.
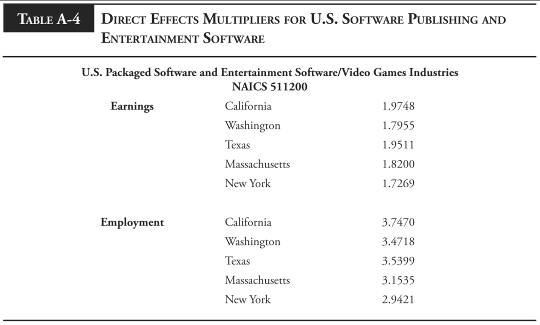
Similarly, direct effects multipliers for the U.S. software publishing industry in the five states of California, Washington, Texas, Massachusetts and New York are provided in Table A-4. The same multipliers were used to measure economic impacts of piracy on the U.S. entertainment software and video games industry as well.
Appendix B — Determining Tax Losses
The RIMS II model cannot be used to generate multipliers for the tax payments that would have been made by employees and corporations if copyright piracy were reduced. For this reason, the analysis of the tax effects of piracy losses in this study makes use of financial accounts for the U.S. as a whole and of industry specific information on the components of the value added that would increase if copyright piracy were significantly curtailed or eliminated.
Personal and Corporate Income Taxes
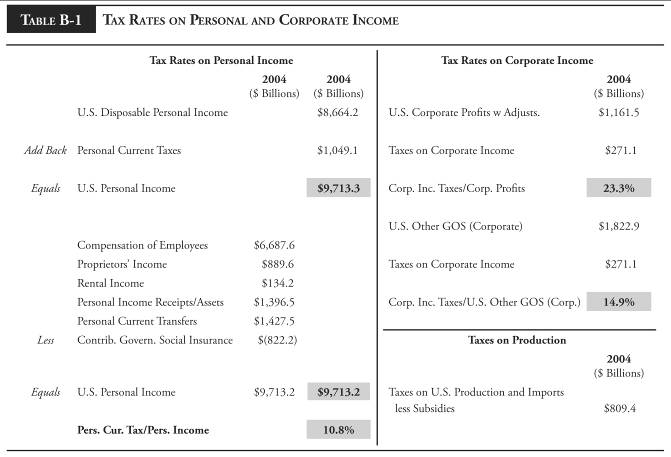
Within the financial accounts of the United States, one can readily identify the taxes paid in aggregate by U.S. resident individuals and U.S. corporations as a whole. For example, in 2004, personal (current) taxes paid by U.S. residents totaled $1,049.1 billion. As shown in Table B-1, these taxes amounted to 10.8% of the total U.S. disposable personal income for the same year. While U.S. disposable personal income was derived from many sources, it is assumed in this analysis that all forms of personal income were in effect taxed at the same average rate. Under this assumption, the U.S. average personal tax rate in 2004 was 10.8%.
In this report, the personal income taxes that are lost as a result of copyright piracy are derived by applying the assumed personal tax rate of 10.8% to the total (direct and indirect) lost employee earnings that were estimated using the appropriate RIMS II multipliers. As shown in the text of this report at Table 2, those lost earnings were $16.281 billion. Assuming a 10.8% personal income tax rate, these lost earnings result in lost personal income taxes of $1.759 billion.
The data in Table B-1 also show two separate calculations of the corporate income tax rate paid by U.S. corporations to federal, state and local tax authorities in 2004. In 2004, total corporate income taxes were $271.1 billion. Dividing this figure by total U.S. corporate profits as adjusted of $1,161.5 billion yields an average corporate tax rate of 23.3%. 23
Unfortunately, in the U.S. accounts, corporate profits by industry are not to our knowledge reported by any of the U.S. statistical agencies in the same format as shown above. The U.S. Bureau of Economic Analysis does report industry data on Gross Operating Surplus (GOS) by industry in its calculations of value added by industry. Using these data, GOS by industry can be divided into five underlying categories. The categories include “Other GOS” which can be defined as corporate profits before tax plus net interest and miscellaneous payments and adjustments. While this measure is broader than U.S. corporate profits, it does provide an approximate measure of corporate profits on an industry-by-industry basis.
In Table B-1, U.S. corporate income taxes are also divided by “Other GOS” for corporations, an amount reported as $1,822 billion in 2004. This calculation yields a corporate tax rate on Other GOS of 14.9%.
Production Taxes and Gross Operating Surplus
The major components of U.S. value added and value added for the industry sectors classified under NAICS 512 (motion pictures and recorded music) and NAICS 511 (all publishing including software) are shown in Table B-2. The three components are employee compensation, taxes on production and imports less subsidies and gross operating surplus. As shown in Table B-2, for these broad industry sectors, production taxes can be divided by employee compensation in order to derive industry-specific factors for the taxes. In Table B-2, production tax factors are derived for NAICS 512 and 511. These tax factors are subsequently used to estimate the production taxes lost for each of the four copyright industries that are analyzed in this report. For each industry, the production tax factor is applied only to the direct employee compensation that was lost as a consequence of piracy. The production tax factor is not applied to the indirect employee compensation that was also lost because the RIMS II model does not provide a breakdown of that lost compensation for each industry affected. For this reason, the production tax estimate derived in this report should be regarded as a conservative measure of the minimum production tax losses that can be attributable to copyright piracy.
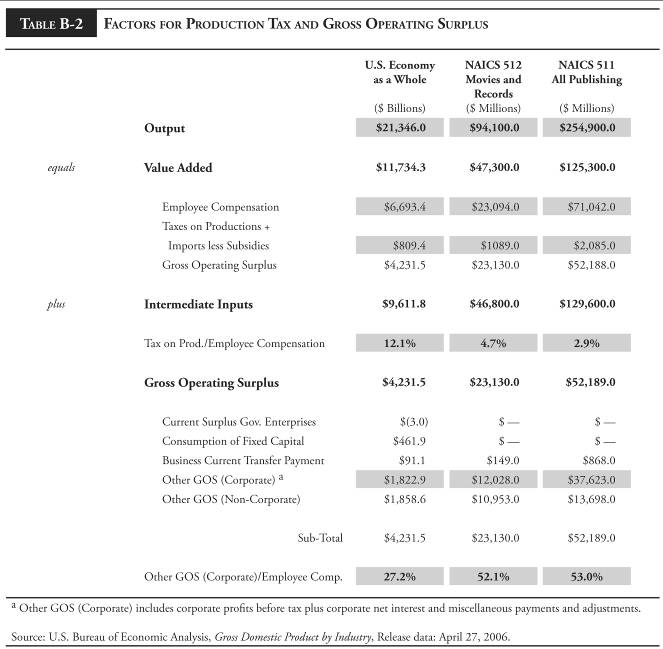
As shown in Table 5 in the text, the estimated direct industry earnings lost to copyright piracy were $7.164 billion. The production tax factors for the industry sectors shown in Table B-2 (4.7% and 2.9%) were applied to the lost direct earnings for each copyright industry in order to derive an overall estimate of lost production taxes of $263 million (See Table 4).
In Table B-2, industry sector data is also reported for gross operating surplus. Recall that in this analysis, the corporate tax rate previously calculated in Table B-1 was measured as a tax on gross operating surplus. In Table B-2, the gross operating surplus is reported by industry sector. The ratio of “Other” GOS (Corporate)” to employee compensation is also calculated for each of the two industry sectors. This ratio is then applied to the lost employee earnings calculated for each of the four copyright industries that are analyzed in this report. The application of these sector-specific ratios to each of the four copyright industries yields estimates of the gross operating surplus earned by each of the four industries. The corporate tax factor estimated in Table B-1 is then applied to the estimated gross operating surplus for each industry in order to derive corporate income taxes lost through piracy. As shown in the text in Table 4, these lost corporate income taxes were $557 million. Note that, like the production tax estimate, the corporate income tax calculation was applied only to the direct industries affected by piracy. For this reason, this estimate should also be regarded as a minimum value for the corporate income taxes lost as a consequence of global copyright piracy.
Endnotes
- See U.S. Census Bureau, Statistics of U.S. Businesses – 2004 , for NAICS 5121- Motion Pictures and Video Industries and NAICS 5112 – Software Publishing Industry.
- “Other” industries here mean the U.S. industries that supply intermediate goods and services directly to the U.S. copyright industries and the U.S. industries that directly and indirectly supply these supplier industries.
- http://nbcumv.com/corporate/Engines_of_Growth.pdf
- Siwek, Stephen, E., The True Cost of Motion Picture Piracy to the U.S. Economy , Institute for Policy Innovation, Policy Report 186, September 2006, http://www.ipi.org
- The North American Industry Classification System (NAICS) is used by U.S. statistical agencies such as the Census Bureau and the U.S. Bureau of Economic Analysis to classify industrial sectors, groups and industries.
- U.S. Census Bureau, Estimated Revenue for Employer Firms: 2004 through 2005, Table 3.0.1.
- U.S. Census Bureau, 2005 Service Annual Survey, Table 3.0.1.
- U.S. Office of Management and Budget, North American Industry Classification System, United States, 2002 , 511210 Software Publishers.
- U.S. Census Bureau, 2005 Service Annual Survey, Table 3.0.1
- The NPD Group, Inc., 2006 U.S. Video Game and PC Game Retail Sales reach $13.5 Billion Exceeding Previous Record Set in 2002 by Over $1.7 Billion,January 19, 2007.
- Siwek, Stephen, E., 11. Siwek, Stephen, E., Copyright Industries in the U.S. Economy – The 2006 Report , International Intellectual Property Alliance, Table A-5, Page 18.
- In most copyright products, the content provided to consumers is a public good but the mechanism of delivery is frequently in the form of a private good like a CD or DVD.
- Owen, Bruce M.; Wildman, Steven, S., Video Economics , Harvard University Press, 1992, page 23.
- See Siwek, Stephen, E., The True Cost of Motion Picture Piracy to the U.S. Economy , Institute for Policy Innovation, Policy Report 186, September 2006, Appendix C.
- IFPI, 2006 Global Recording Industry in Numbers, August 2006, page 9.
- In recorded music, physical piracy is the unauthorized sale or consumption of protected music on a physical medium such as compact disk. Physical piracy can be distinguished from “download” piracy in which protected music is transferred using virtual media such as an MP3 computer file.
- For example, as noted earlier in this report, IFPI estimated that in 2005, the value of the worldwide market for pirate CDs was $4.5 billion at pirate prices.
- Siwek, Stephen E., The True Cost of Motion Picture Piracy to the U.S. Economy , Institute for Policy Innovation, Policy Report 186, September 2006, Appendix C – Conclusions of the LEK Study, page 24.
- In the RIMS II model, the multipliers used to derive changes in output and employment for the supplier industries that are affected indirectly by piracy are not identified on an industry-by-industry basis. For this reason, supplier industry values for employee compensation, gross operating surplus and taxes on production are not available. As a result, the tax effects that would result from changes in these supplier industry values cannot be measured using RIMS II.
- NOTE: The RIMS II Model produces separate industry-specific multipliers that can be used to estimate employment and earnings effects in the “direct” industries under study.
- Siwek, Stephen E., The True Cost of Motion Picture Piracy to the U.S. Economy , Institute for Policy Innovation, Policy Report 186, September 2006, page 14.
- Id. Pages 14-15.
- In these figures, corporate profits have been adjusted to reflect changes in inventory valuation and capital consumption.
About the Author
Stephen E. Siwek is Principal at Economists Incorporated, a research and consulting firm with offices in Washington D.C. and in the San Francisco Bay area. Active in research and consulting for over 30 years, Mr. Siwek specializes in the analysis of economic, financial, and accounting issues. He has testified as an expert witness before regulatory bodies and courts on more than 80 occasions.
Mr. Siwek has particular expertise in the economic analysis of the U.S. entertainment industries and of the related U.S. industries that depend on the effective protection of their copyrights. Since 1990, Mr. Siwek has published eleven studies on behalf of the International Intellectual Property Alliance (IIPA) that analyzed in detail the economic importance of the U.S. “copyright” industries (including the sound recording industry) to the U.S. economy. In these studies, Mr. Siwek quantified the substantial contributions made by the copyright-based industries to U.S. economic growth, employment and foreign trade.
Mr. Siwek has also been instrumental in furthering the efforts of the World Intellectual Property Organization (WIPO) to encourage other nations to measure the economic contribution of copyright-based industries in their own countries. In this regard, Mr. Siwek has been closely associated with the development of the WIPO “Guide” for the measurement of copyright industry contributions and he has directly assisted a number of foreign governments in the preparation of their own studies.
Mr. Siwek is co-author of International Trade in Films and Television Programs (American Enterprise Institute/Ballinger Publishing Company, 1988) and International Trade in Computer Software (Quorum Books, 1993).
In 2005, Mr. Siwek authored a widely reported study entitled Engines of Growth: Economic Contributions of the U.S. Intellectual Property Industries (Commissioned by NBC Universal, 2005). In that study, Mr. Siwek quantified the substantial contributions made by the IP sector as a whole to real U.S. growth. More recently, Mr. Siwek authored a study on the effects of motion picture piracy on the U.S. economy as a whole. That study was entitled The True Cost of Motion Picture Piracy to the U.S. Economy , (Institute for Policy Innovation, Policy Report 186, September 2006).
In February of 2007, Mr. Siwek participated as a panelist in the Motion Picture Association of America’s first-of-its-kind industry symposium entitled, The Business of Show Business . In May 2007, he also served as a panelist for the launch of the Copyright Alliance, a non-profit education group whose 29 member organizations represent an estimated 11 million Americans working in the copyright sector.
Mr. Siwek earned his undergraduate degree at Boston College and his M.B.A. at George Washington University.
About the Institute for Policy Innovation
The Institute for Policy Innovation (IPI) is a nonprofit, non-partisan educational organization founded in 1987. IPI’s purposes are to conduct research, aid development, and widely promote innovative and nonpartisan solutions to today’s public policy problems. IPI is a public foundation, and is supported wholly by contributions from individuals, businesses, and other non-profit foundations. IPI neither solicits nor accepts contributions from any government agency.
IPI’s focus is on developing new approaches to governing that harness the strengths of individual choice, limited government, and free markets. IPI emphasizes getting its studies into the hands of the press and policy makers so that the ideas they contain can be applied to the challenges facing U.S. today.
About the IPI Center for Technology Freedom
The IPI Center for Technology Freedom is the technology division of the Institute for Policy Innovation. The purpose of the Center is to sort out the policy challenges posed by technological change for both the American people and policy makers.
The IPI Center for Technology Freedom points the way for a society that encourages freedom to develop new technologies, and the freedom to access them.